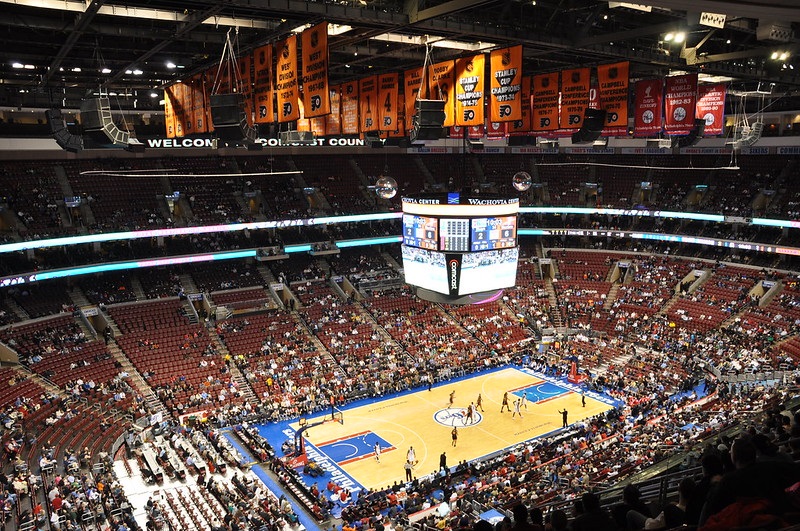
Image Credit: Kevin Burkett (CC BY-SA 2.0)
The 2013-2014 season ended in spectacular fashion with the San Antonio Spurs avenging their NBA Finals loss to the Miami Heat from the previous season. Kevin Durant was the league's MVP averaging 32 points per game. This season also marked the end of the Lebron era in Miami as he chose to return to the Cleveland Cavaliers for the upcoming season.
Here are the attendance numbers for each of the 30 NBA teams for the 2013-2014 NBA season.
|
Venue/Team |
Overall Season Attendance |
Avg. Nightly Attendance |
Percentage of Capacity |
|
1. United Center (Bulls) |
890370 |
21716 |
103.80% |
|
2. American Airlines Center (Mavericks) |
817982 |
19950 |
103.90% |
|
3. Madison Square Garden (Knicks) |
812292 |
19812 |
100.00% |
|
4. American Airlines Arena (Heat) |
811036 |
19781 |
100.90% |
|
5. Moda Center (Trail Blazers) |
809612 |
19746 |
95.00% |
|
6. Oracle Arena (Warriors) |
803436 |
19596 |
100.00% |
|
7. Staples Center (Clippers) |
787, 692 |
19212 |
100.80% |
|
8. Staples Center (Lakers) |
771, 974 |
18828 |
98.80% |
|
9. AT&T Center (Spurs) |
755031 |
18415 |
99.10% |
|
10. Air Canada Centre (Raptors) |
748339 |
18252 |
92.20% |
|
11. Chesapeake Energy Arena (Thunder) |
746323 |
18203 |
100.00% |
|
12. EnergySolutions Arena (Jazz) |
745203 |
18175 |
91.30% |
|
13. Toyota Center (Rockets) |
743082 |
18123 |
100.40% |
|
14. TD Garden (Celtics) |
742400 |
18107 |
97.20% |
|
15. BankersLife Fieldhouse (Pacers) |
717542 |
17501 |
96.30% |
|
16. Quicken Loans Arena (Cavaliers) |
710522 |
17329 |
84.30% |
|
17. Barclays Center (Nets) |
707331 |
17251 |
95.30% |
|
18. Verizon Center (Wizards) |
698068 |
17026 |
84.00% |
|
19. Pepsi Center (Nuggets) |
692898 |
16899 |
88.20% |
|
20. Fedex Forum (Grizzlies) |
685458 |
16718 |
92.30% |
|
21. Smoothie King Center (Pelicans) |
672029 |
16390 |
95.40% |
|
22. Sleep Train Arena (Kings) |
667949 |
16291 |
94.10% |
|
23. Amway Center (Magic) |
666046 |
16245 |
86.20% |
|
24. US Airways Center (Suns) |
650739 |
15871 |
86.20% |
|
25. Time Warner Cable Arena (Hornets) |
636268 |
15518 |
81.30% |
|
26. Palace of Auburn Hills (Pistons) |
615238 |
15005 |
68.00% |
|
27. Target Center (Timberwolves) |
597157 |
14564 |
75.20% |
|
28. Philips Arena (Hawks) |
587927 |
14339 |
76.60% |
|
29. Wells Fargo Center (76ers) |
568632 |
13869 |
68.20% |
|
30. BMO Harris Bradley Center (Bucks) |
552967 |
13487 |
72.10% |
For the fifth straight season, the Chicago Bulls led the NBA in attendance despite star player Derrick Rose' frequent absences. 8 teams sold out every single game during their 2013-2014 campaign. The Indiana Pacers saw a huge increase in attendance with roughly 100,000 additional fans through the gates from the previous year. The Orlando Magic saw perhaps the largest drop in attendance from the previous year with 60,000 fewer fans. With the return of Lebron James to Cleveland, I anticipate the Cavaliers to have a huge surge in attendance during the 2014-2015 season.
For the past three seasons, the Milwaukee Bucks, Detroit Pistons and Sacramento Kings have finished in the bottom 5 in the NBA in attendance. Sure, they never made the playoffs during those seasons but I've always said the location of the Pistons and Kings' arenas have hindered home attendance. If the Kings and Pistons played in arena in their cities' downtown area, I think each franchise would see a huge boost in attendance. The Palace of Auburn Hills is a solid 35+ minute drive from downtown Detroit. There is some anticipation that the Pistons will move to downtown Detroit to share an arena with the NHL's Red Wings in coming years.
Related Articles
- 2012-2013 NBA Attendance Recap
- 2011-2012 NBA Attendance Recap
- 2014-2015 NBA Team Salaries and Payroll
- 2013-2014 NBA Team Salaries and Payroll
- 2012-2013 NBA Team Salaries and Payroll
- NBA Arenas - Construction Cost Rankings

